VISORA Case Studies
Brussels Bar Show
Measuring Visitor Engagement at a Live Exhibition
Challenge
How can an exhibitor understand whether visitors are truly engaging with a stand rather than simply walking past?
Solution
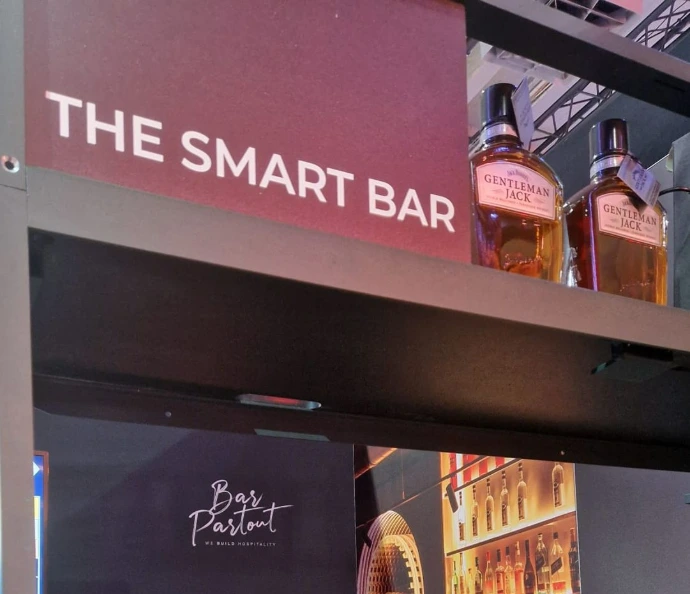
The VISORA Smart Bar was deployed at the Bar Partout stand during the Brussels Bar Show.
Key Insights
- Visitor traffic
- Stand conversion rate
- Dwell time
- Visitor engagement
- Peak activity periods
Business Value
For the first time, Bar Partout could objectively measure how many visitors passing the stand actually stopped, engaged and converted into meaningful interactions.
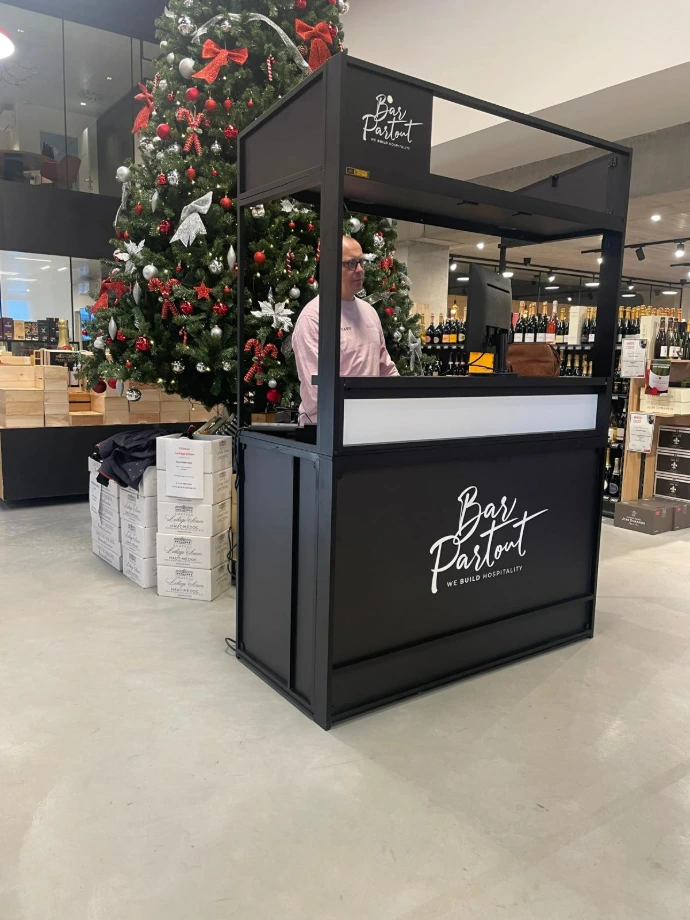
Wijnhuis Bollaert
Optimizing Product Positioning through Behavioral analytics
Challenge
Where should premium products be positioned inside a retail environment to maximize visibility and engagement?
Solution
VISORA generated behavioral heatmaps that visualized how customers moved throughout the store.
Key Insights
- Heatmaps
- Customer flows
- High-value visitor zones
- Product visibility
- Dwell time
Business Value
The project identified the areas receiving the highest customer attention, providing objective guidance for future product placement and merchandising decisions.
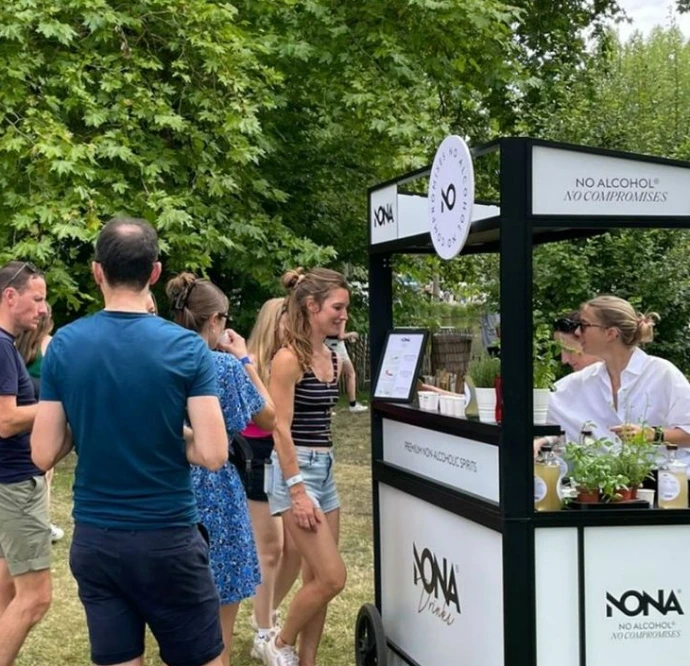
NONA Drinks
Turning Brand Experience into Measurable Data
Challenge
How do consumers interact with a premium alcohol-free brand experience?
Solution
VISORA measured visitor behavior around the activation and transformed engagement into quantifiable insights.
Key Insights
- Visitor engagement
- Dwell time
- Interaction levels
- Behavior around the activation
- Demographic observations
Business Value
Instead of relying on subjective observations, NONA obtained measurable data describing how visitors experienced the activation.
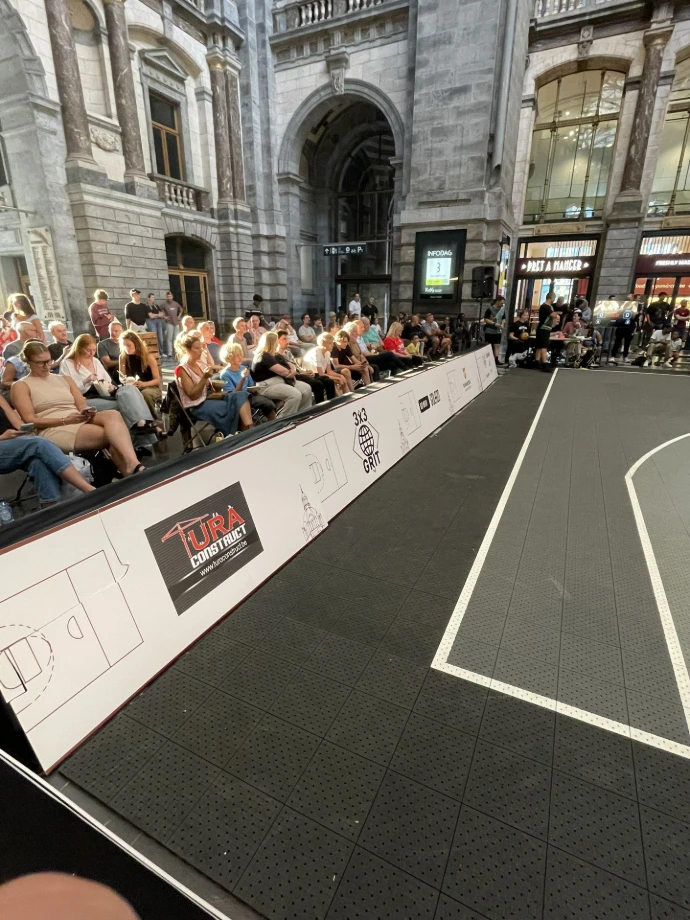
GRIT 3x3
Measuring audience Exposure at a Live sports Event
Challenge
How can a sports event objectively measure audience traffic, engagement and sponsor exposure in a busy public environment?
Solution
VISORA deployed edge-based vision analytics during the GRIT 3x3 event at Antwerp Central Station to measure visitor behaviour around the basketball court and event environment.
Key Insights
- 2499 unique people detected
- 4h 43min validated measurement period
- 2min average dwell time
- 6% conversion to selected zone
Key Insights
- Measurable event reach
- Visitor traffic and peak periods
- Dwell time
- Zone conversion
- Potential sponsor exposure
- Foundation for activation-level measurement
Business Value
Even with only one limited measurement zone, VISORA identified 2,499 unique people during less than five hours of validated measurement. The project demonstrates how event organisers can complement traditional attendance reporting with objective behavioural data, and create a new measurement layer for sponsors and brand activations.
Early Adopters & Collaborations